Student Achievement
Math & Writing Completion
Percentage of first time in college students completing program-level math & writing requirements in year one
These student cohorts are new first time in college credit students seeking a Lane credential of 1 year or longer who have (self-reported) not previously attended college. These students started in Fall term. Program-level means a course specifically required for the student’s declared program. The terms “program-level” and “gateway” may be used interchangeably but note that for some career technical credentials, program-level math courses may be below 100-level. Successful completion is a grade of P or C- or better.
Math
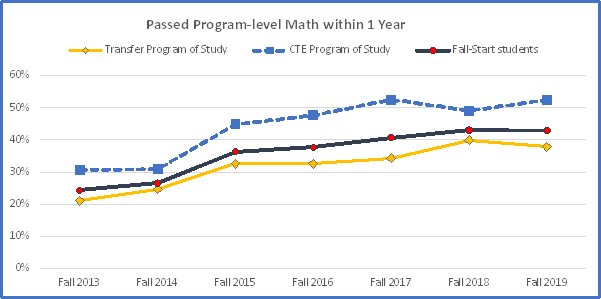
Lane’s one-year program-level math completion rate increased over the last 5 years, from 24% for the 2013 cohort to 43% for the 2019 cohort. An increase in 9 percentage points was seen between the 2014 and 2015 cohorts. Early gateway math completion builds a foundation for academic and career success and is known as a predictive key indicator correlated with graduation.
| Fall 2013 | Fall 2014 | Fall 2015 | Fall 2016 | Fall 2017 | Fall 2018 | Fall 2019 | |
|---|---|---|---|---|---|---|---|
| Fall-start students | 24% | 27% | 36% | 38% | 41% | 43% | 43% |
| Transfer Program of Study | 21% | 25% | 33% | 33% | 34% | 40% | 38% |
| CTE program of study | 31% | 31% | 45% | 48% | 53% | 49% | 52% |
Writing
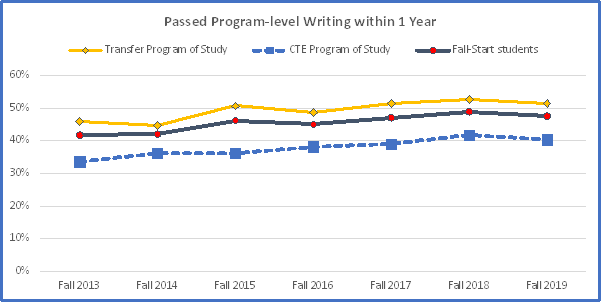
Lane’s one-year program-level writing completion rate improved in four of the last five years, increasing from 42% for the 2013 cohort to 48% for the 2019 cohort. Early gateway writing completion builds a foundation for academic and career success and is known as a predictive key indicator correlated with graduation.
| Fall 2013 | Fall 2014 | Fall 2015 | Fall 2016 | Fall 2017 | Fall 2018 | Fall 2019 | |
| Fall-start students | 42% | 42% | 46% | 45% | 47% | 49% | 48% |
| Transfer Program of Study | 46% | 45% | 51% | 49% | 51% | 53% | 51% |
| CTE Program of Study | 34% | 36% | 36% | 38% | 39% | 42% | 40% |
Graduation & Transfer
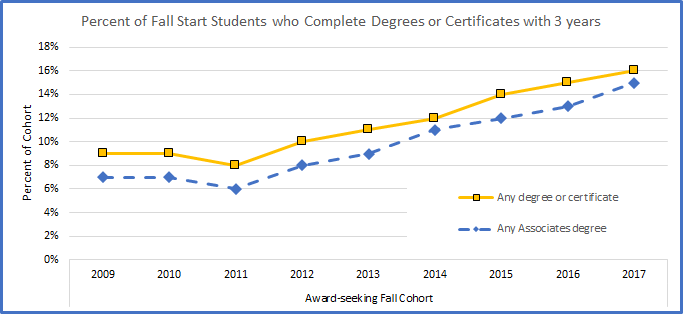
This graph shows how many Lane students completed a Lane credential within 3 years, for fall cohorts starting from fall 2009 to fall 2017 (AY09/10 to AY17/18). The award-seeking fall cohort includes any credit student seeking any credential of 1 year or longer. Awards are counted based on completion of requirements AND conferral of award. Approximately 1.4% of students completed an award within 3 years but conferral was delayed beyond the 3-year timeframe.
For example, from the new credit students seeking a credential of 1 year or longer who started in September 2017, 16.3% completed a degree or certificate by August 2020 and 14.6% completed an associate's degree.
| 2009 | 2010 | 2011 | 2012 | 2013 | 2014 | 2015 | 2016 | 2017 | |
| Any degree or certificate | 9% | 9% | 8% | 10% | 11% | 12% | 14% | 15% | 16% |
| Any Associates degree | 7% | 7% | 6% | 8% | 9% | 11% | 12% | 13% | 15% |
![]()
This pie chart shows the percentage of new award-seeking students from fall 2017 (AY17/18) that had completed a Lane credential and/or transferred to another college within 3 years (i.e., by the end of summer 2020).
| Award (any) without Transfer (any) | 10% |
| Award (any) with Transfer (any) | 6% |
| Transfer (any) without Award (any) | 24% |
| No Award or Transfer (any) | 60% |
![]()
This graph shows how many award-seeking Lane students transferred to another college within 3 years, for fall cohorts starting from fall 2009 to fall 2017 (AY09/10 to AY17/18). Rates for transfer and CTE students are shown separately.
| 2009 | 2010 | 2011 | 2012 | 2013 | 2014 | 2015 | 2016 | 2017 | |
| Transfer Students, Any School | 33% | 33% | 34% | 31% | 34% | 33% | 36% | 38% | 36% |
| Transfer Students, 4-yr Schools | 23% | 24% | 23% | 21% | 24% | 25% | 27% | 29% | 26% |
| CTE Students, Any School | 16% | 18% | 16% | 15% | 19% | 16% | 22% | 19% | 21% |
| CTE Students, 4-yr Schools | 8% | 9% | 8% | 7% | 10% | 8% | 13% | 9% | 11% |